Preference reversal: a primer
If you have recently spent fifteen minutes staring at a baffling array of pie charts and percentages on my behalf, thank you. I wrote this post because I thought a small number of you may want to know what it was all about.
What it was all about was ‘preference reversal’. The good news is, this is actually a very simple concept to explain, and I would argue, a very interesting one, even if you don’t care to familiarise yourself with the psychological or economic theory behind it. It can best be described as a tendency to pick one uncertain outcome (in my experiment, called a gamble) over another, but then place a higher value on the second one, when asked what they are worth. Needless to say, it doesn’t seem to make a lot of sense, regardless of whether you’re an economist.
I've split this up into sections so you only have to read the bits you're interested in. If you just want a summary of what it's all about, read Origins, Where my research fits in and My experiment. If you want the whole picture, read it all until Colophon. If you're also interested in an explanation and mini-review of the technologies I used, try Colophon as well.
Origins
Preference reversal was first ‘discovered’ — or, observed — by two American psychologists called Paul Slovic and Sarah Lichtenstein in the early seventies. They did so by offering subjects (it’s a harsh word, you can pretend I’m using ‘people’ instead, if you want) a choice between two bets — a ‘P-bet’, one with a high chance of winning a small amount of money, and a ‘$-bet’, one with a low chance of winning a large amount of money — and then asked them to value each bet individually. They found a very strong tendency for subjects to choose the P-bet but value the $-bet higher. Because around two thirds of subjects always did this, and barely any made the opposite reversal, they argued that this represented a systematic effect, and not just misunderstandings and a slight randomness of expression (which should cause reversals in both directions equally).
Although Slovic and Lichtenstein replicated their results several times after their first foray into the topic (including, quite wonderfully, in a Las Vegas casino), psychologists didn't spend much time on it throughout the seventies, and to an extent, haven't ever since. However, in 1979 two economists named David Grether and Charlie Plott picked up on the research and argued for its relevance to economics. Their argument was based around the fact that, in economics, we assume that people have consistent ‘preferences’ in mind over anything you could offer them. And, very simply, it isn’t hard to see how preferring one thing but valuing another more highly means that preferences appear not to be consistent. Whilst this is fairly inconsequential to the integrity of psychologists' prior work (their response was mostly acceptance that preferences are not independent of the process used to find them out), it would have massive implications for a whole range of areas within economics due to a reliance assumption-heavy preference theory:
"It suggests that no optimization principles of any sort lie behind even the simplest of human choices and that the uniformities in human choice behavior which lie behind market behavior may result from principles which are of a completely different sort from those generally accepted."
Grether and Plott, however, were quite sure that preference reversal was not applicable to economics, and were very open in their intentions to prove this in their paper. No such luck, however:
"Needless to say the results we obtained were not those expected when we initiated this study…The preference reversal phenomenon which is inconsistent with the traditional statement of preference theory remains."
Explanations
Grether and Plott started an interesting trend in this literature: making consistent and aggressive attempts to prove it was a load of rubbish. Lakatos would call it a legitimate defence of hard core assumptions, but I’m a bit more sceptical of its sincerity. I can’t help but feel this started with their slightly baseless suggestion that initial research was invalid purely because it was done by psychologists. To be fair, they raised a lot of legitimate concerns as well, although they all turned out not to affect the result. This pattern continued throughout the eighties, and to an extent to the current day, with numerous papers picking faults in past experimental technicalities, which they argued invalidated preference reversal findings. The phenomenon was lessened slightly when subjects were offered greater amounts of money, but it was never truly explained away with this line of reasoning.
Inevitably, then, the focus had to switch to accepting the true existence of preference reversal and proposing reasons why it occurs, and ideally ones that aren’t too damaging to the well-established assumptions about preference. These mainly fall into two distinct categories.
Preferences are stable but not transitive. [Transitivity is a standard assumption of preference theory and states that, if you prefer apples to bananas, and prefer bananas to coconuts, you must prefer apples to coconuts.] One account of why preferences could violate this but still be stable and well-defined is ‘regret theory’, which says that when you consider gambles you put particular importance on the potential regret of what might have been, if you lose. I’m not going to explain why here. Preferences being intransitive has some implications for the theory, but this theory crucially maintains the assumption that preferences are stable, which would be far more damaging to reject.
Preferences are stable but not fully reflected in decisions. Decisions are constructed based on the type of decision being made, rather than being pure expressions of underlying preferences. Other branches of this state that decisions are subject to a degree of imprecision and ‘error’, which could make it look like preferences are being reversed. This isn't too damaging to preference theory, as it implies that preferences could fulfill all the assumptions, although if preferences are not perfectly expressed, it does raise questions about the relevance of studying preferences at all (as opposed to choices, an approach of Paul Samuelson's).
I think it’s most likely the explanation is a combination of both of these. Another explanation is that preferences are not stable, but this scares economists a bit so there hasn’t been much work into it. All the time evidence can justify the two reasons above, there doesn’t need to be, I suppose.
Where my research fits in
One thing I became increasingly aware of when reading about preference reversal in search of a dissertation topic was that the sort of ‘errors’ that the second explanation refers to were taken as given, with few questions being asked about what type of person was more likely to make them. In my research proposal I wondered out loud whether people of lower cognitive ability were more likely to show preference reversal, and, secondarily, whether this was because they made more errors in decision tasks. Economists talk of ‘bounded rationality’ — that people are as rational as they are able to be — so, does cognitive ability limit people’s ability to hold consistent preferences, to express them, or both?
This seems like a fairly relevant question to ask, and I hope you feel the same, but I couldn’t find a single mention of it in the preference reversal literature (which consists of hundreds of papers). Meanwhile, in similar fields of behavioural economics, the effects of cognitive ability has been fairly well researched; for example, two papers asking whether people of higher cognitive ability are less averse to risk have been particularly helpful for me in working out my methodology.
My experiment
In economics, experiments are most usually carried out in labs, where subjects sit in front of a computer and complete tasks in complete isolation from other subjects. In some, the computers are networked so that subjects interact with others in the room, albeit anonymously. Laboratory testing mostly takes place in the US, but in the UK, it's almost exclusively at the Universities of Nottingham, East Anglia and York. Students can spend an hour or so taking part and earn up to around £10, depending on their performance in the tasks. They’re like medical or psychological experiments, although perhaps not quite as invasive!
This is where most existing preference reversal research has taken place, but unfortunately as a lowly undergraduate, the expense involved meant it was sadly beyond my means. Instead I came up with the idea of running an online experiment — almost like a survey — that friends and family could complete in their own time, as a favour to me, instead of expecting to earn money. Therein would lie the biggest criticism were this publishable research — the lack of monetary payoffs means people have no incentive to make decisions thoughtfully. However, my gut feeling is that people can ‘imagine’ payoffs almost as well as if money was actually at stake, and especially in this case, where they’re doing so to help me out with my schoolwork. At an academic level this reasoning would not be accepted, but as an undergraduate dissertation, I like to think it's not a major problem.
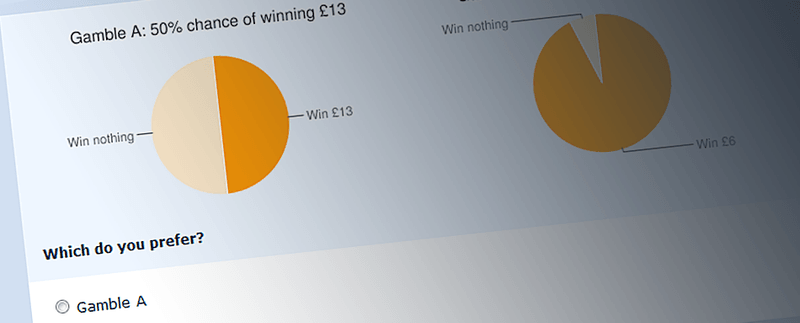
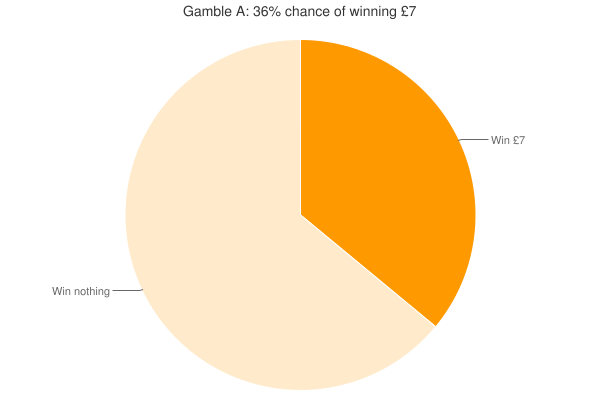
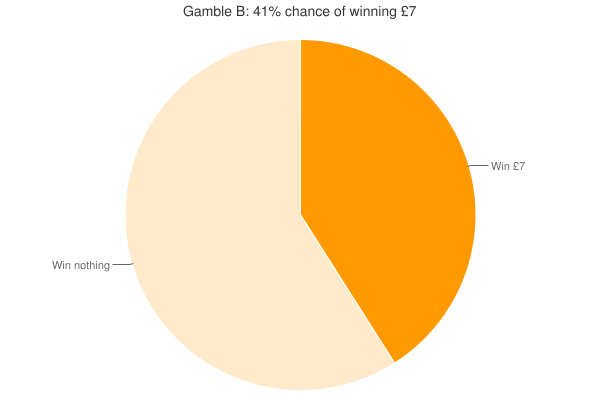
So, if you recall, you were given 6 sets of gambles and asked to choose between 2 each time (making 12 gambles in total), and then asked to value 12 gambles. In both tasks these 12 gambles were the same, although shown to you in a random order so the whole thing wasn’t too obvious. You were then asked 12 fairly abstract questions which formed the ‘cognitive ability’ test — a kind of IQ test-lite. What I was then able to do is compare your choices and valuations and calculate in how many of the six sets you reversed your preferences, and in how many your preferences were consistent. I was then able to compare this with your score on the cognitive test to see whether the two were linked. For a summary of results, see the next section.
Testing for intelligence is, of course, a massive can of worms and it should be obvious that no 12-question test conducted in uncontrolled conditions could ever be a good assessment of it. This may even be the biggest criticism of my paper, and would certainly render it useless in psychological circles. All of that notwithstanding, I feel justified in saying that, within the significant constraints of my methodology, the test was a good proxy variable for intelligence since it covered four different types of reasoning, and was shown in my results to be neither too easy nor too hard.
Back to the gambles. You may remember one set being fairly strange (see below). In this case, as one gamble was better than the other in every way, if you valued the worse one (gamble A) higher than the better one (gamble B) I took this to be a simple 'error' so I could investigate whether this caused other preference reversals, and whether people with lower cognitive ability were more likely to make more errors. Reassuringly, no one chose the worse gamble (although 5 people strangely said they were indifferent), but 14 people valued it more highly (d’oh?).
Results
In total I ended up with 103 complete responses, which blew me away, especially since I wasn’t convinced that I would break 30 to begin with. Interestingly, there were an additional 51 responses that were started but not finished. Entirely predictably, most people decided to call it a day upon reading the instructions for the valuation tasks (I spent ages trying to make it as simple as possible, honest!) But that’s okay.
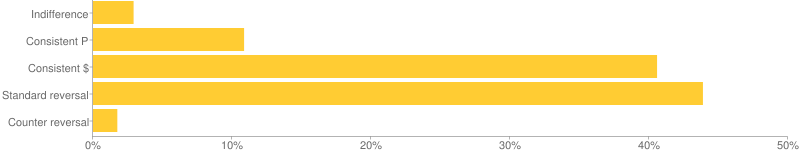
Before I could test my hypothesis I needed to be sure that my preference reversal results were in line with most other research in the field. Sure enough, of the 515 pairs of decisions I had to analyse, 44% were standard preference reversals, and only 3% were the opposite reversal. In other words, of everyone who chose the P gamble, 80% went on to value the $ gamble higher. Of everyone who chose the $ gamble, only 4% valued the P gamble higher. Another 51% were consistent decisions, and the remaining 2% were indifferent choices that I was unable to analyse.
Confident that I had achieved meaningful results, I could turn to my question about whether cognitive ability affects preference reversal. It turns out that there is something to it. On average, people of lower cognitive ability were not more likely to make preference reversals in a yes/no binary sense, but, when they did, made valuations that disagreed with their choices by statistically significantly larger amounts – in both absolute (i.e. dollar amount) and relative (i.e. as a percentage of the amount) terms. When high cognitive ability people reversed, they did so by 26% of the value they placed on the gamble they chose; low cognitive ability subjects, however, reversed by 54%.
The supposed link between cognitive ability and error-making was also found: earning one more point on the cognitive test made you 4% less likely to make the ‘error’ described above.
This point brings me up to the current stage in my research. My conclusion is that people of lower cognitive ability make more drastic preference reversals, which is partially (but only partially) caused by them being more likely to make simple errors on the valuation tasks. This is a fairly simple conclusion, and I’m not sure if I’ll be able to extend it in another ways; this’ll depend on whether I have any brainwaves, or whether my supervisor has any useful suggestions. He's a bit of an expert on preference reversal, so there’s a good chance he will.
Talking to people after the experiment, some enjoyed it, almost treating it as brain training, whilst some just got confused and worried that they were screwing up my results. A lot of people have said that they thought economics was all stocks and shares and that they didn't know it could be as interesting as this, which is a reaction that I like a lot. Feel free to let me know what you thought in the comments section below.
Colophon
I had a slightly worrying amount of fun setting up this experiment. At first I considered hosting it on a simple survey platform like Surveymonkey or the spreadsheet form entry in Google Documents, but they didn’t offer as much customisation as I felt I needed (and the University’s Ethics Committee has an inexplicable issue with storing data on external providers like these). Right in the nick of time I found LimeSurvey, an open-source survey system that runs on PHP and MySQL, and ran it on hosting kindly provided to me by my good friend Chris Radford. Although LimeSurvey is antiquated and messy in parts, its open-source nature meant I was able to tinker with the code to add things like time limits for the cognitive questions, and a system that tracks how long the subject spends on each question (the data from which I haven’t actually used yet). After working with it for quite a while I realised that it’s actually great software, and with a bit of polishing (and a better support community; wow, don't get me started on that) could become a popular and viable survey platform.
The pie charts that represented the gambles were generated dynamically by Google Charts API (yeah, Google do everything), which was a godsend as it meant that I didn’t need to make 18 different charts in Excel then convert, upload and link each one.
I am also managing the 26 papers that I have referenced so far in my written work using software called Mendeley, which allows me to categories the papers as I wish for easy access, and then to export the citations to Word without having to format them myself. Another piece of great software, and one that I think a lot of research students could benefit from.
I advertised my experiment on Facebook and Twitter initially, as well as with word-of-mouth, and received a surprisingly high number of responses straight away. It’s kind of great to know that people are willing to give up 15-20 minutes of their time to help you out. At one point I decided to tweet the link at a few relevant economists on Twitter and ask that they retweet it to their followers. Tim Harford, author of the Undercover Economist and presenter of More or Less on BBC Radio 4, very kindly obliged and shared the link to his 14,000 followers, which I would estimate contributed around 35-45 responses. Lots of people who saw that retweeted it themselves, which I really didn’t expect, and just shows the power of Twitter, I think. A feel good moment, to be sure.
When I ended the experiment (about 3 weeks after it started), I exported the LimeSurvey data straight to Microsoft Excel, and did probably the most difficult bit of the whole process — devising a series of formulae to calculate the type of reversal for each set, the subject’s average reversal statistics, as well as their score on the cognitive test. Not quite as easy as it sounds, but to Excel’s credit I definitely couldn’t have done it with any other software package.
Finally, I needed some statistical software to do the serious number crunching — including descriptive statistics, multiple linear regression and nonparametric tests. I have used EViews before, which is the defacto econometrics software of the Economics department at Nottingham, but it isn’t free and I didn’t want to do all my data analysis in the library, so I instead found Gretl, which is a very impressive open source econometrics package. In many ways it is actually more user-friendly than EViews, and in areas that is isn’t — well, you can’t argue with the price.
You can read the full paper and even look at the data right here.
That's it! Thanks for reading.